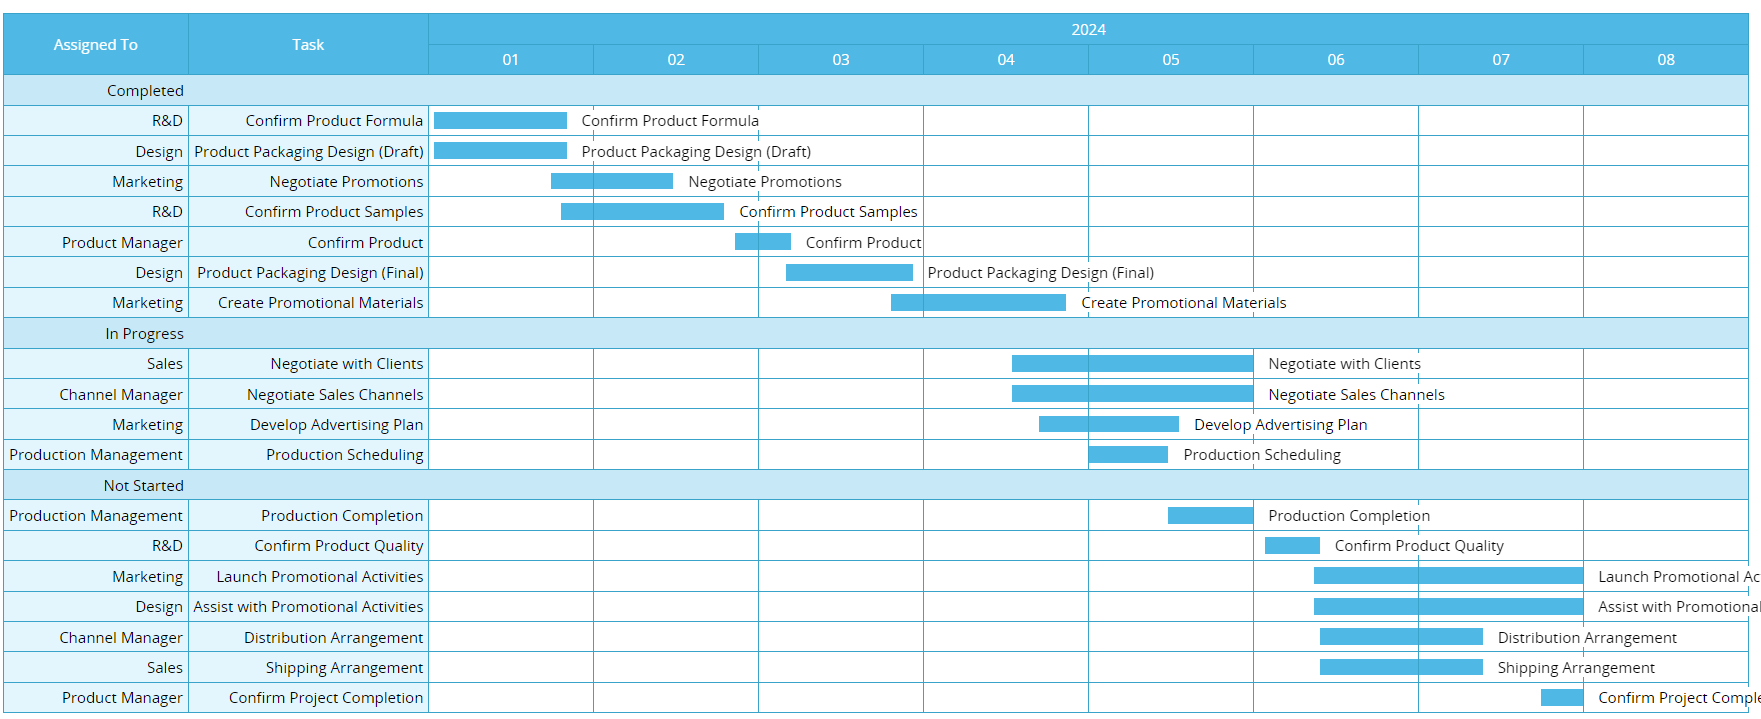
A Gantt chart is a project scheduling tool that uses horizontal bars to visualize a project timeline. The horizontal axis represents time, while the vertical axis lists individual tasks. Each bar corresponds to a task, and the start and end points indicate when the task begins and finishes. The length of the bar represents the task’s duration. In some cases, Gantt charts also show task owners and dependencies between tasks.
By visualizing workflows and task progress, Gantt charts allow teams to quickly understand overall project status and how tasks depend on one another, helping ensure that projects stays on schedule. They also make it easier to identify scheduling conflicts and serve as a useful reference for project managers when planning timelines and allocating resources.
A basic Gantt chart typically includes the following elements:
More advanced or detailed Gantt charts may also include task dependencies or milestones to help teams monitor progress and manage complex workflows more effectively.
One of the biggest advantages of Gantt charts is their ability to visualize complex schedules and workflows. With Gantt charts, project managers can quickly see whether the overall project is ahead of or behind schedule, whether tasks overlap or resources are overly concentrated, and which downstream tasks may be affected if a certain task is delayed. Because of this, Gantt charts are especially useful for projects with clearly defined timelines and task dependencies.
Gantt charts are helpful when a project has:
Common use cases include construction projects, event planning, system implementation, long-term orders, and other project-based work.
Gantt charts may not be suitable for smaller projects and projects that require frequent changes or a high degree of flexibility. In these cases, Gantt charts can become costly and troublesome to maintain, and teams may spend more time updating charts than actually working on the project.
In the past, many people built Gantt charts manually in Excel, but this process is often time-consuming and difficult to maintain. Today, most project management tools offer built-in Gantt chart features. As long as start and end dates are available, the system can automatically generate and update the Gantt chart, keeping schedules aligned with actual progress.

